
How can we disaggregate summary data to assist children and families more holistically?

Overview
Rural Utah Child Development (RUCD) Head Start oversees six counties in Southeastern Utah. For years the program had been relying on summary data that ultimately led to inaccurate decisions in terms of identifying what types of interventions students required to succeed within and outside of their classrooms. In the 2020-2021 program year, the agency piloted analyzing staff requirements, attendance, children’s COR Advantage scores, lesson plan compliance, and parent outcomes, to name a few categories, by the child, by family, and by the center in four different classrooms. Additionally, at the end of the year, as part of each program’s self-assessment, RUCD’s administrators and managers met with teachers, family service workers, and classroom support to analyze their respective classroom-specific data, reflect on the past school year’s goals, and contemplate areas of improvement.
Action
RUCD assembled a team consisting of three data specialists to enter data into a live Google sheet, two coordinators that display the data, and four managers to work with the staff at respective sites to analyze and interpret results, as well as consume the data. The Google sheet feeds into Domo, a modern business intelligence (BI) platform that updates twice a day. This platform allowed RUCD’s Executive Director to pinpoint gaps in services and urge collaboration among education managers, health specialists, and family services specialists to avoid a lack of coordination among staff in regards to students’ needs.
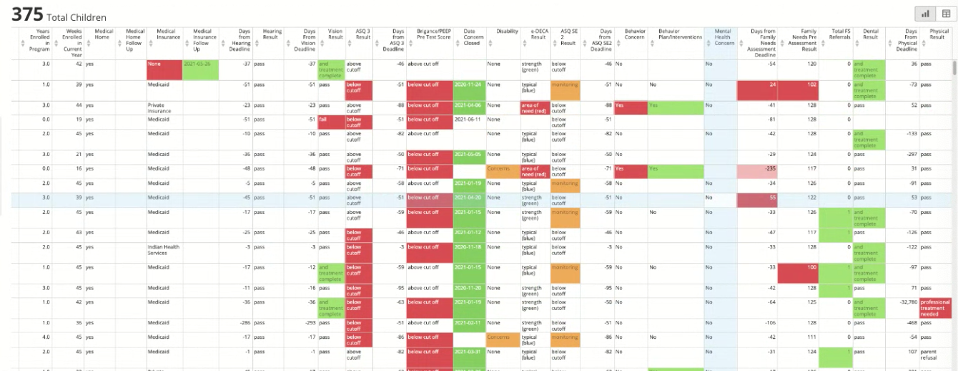
As can be seen in the graphic above, Domo presents a heat map indicating areas of concern in red, associated interventions in green, and areas of continuous monitoring in orange. Once a red cell appears in a child’s profile, the program managers look for neighboring green cells, interventions, to be in place as soon as possible.
This year, RUCD will be working with an outside consultant, Acorn Evaluation, to improve data entry and create a quantitative system to depart from the qualitative measures of ‘above’, ‘meeting’, or ‘below’ indicator thresholds. The goal is to have more performance metrics for the agency’s leadership to digest and present results to both staff and RUCD board members. Additionally, the reorganization of staff to a center manager model will allow one individual to be a specialist leading their teams by scheduling regular meetings, discuss to-do items, and update classroom goals accordingly.
Next Steps
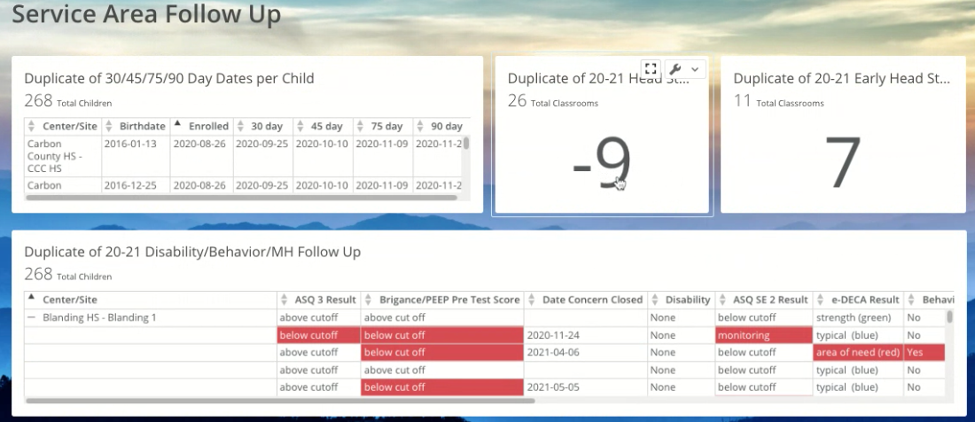
Looking ahead to the next school year, RUCD will analyze progress across various school readiness goals for all students enrolled in their programs. Additionally, data coordinators can assist program managers and administrators by creating dashboards such as the one below to highlight areas of improvement throughout the year, so that children in need of several interventions are identified and assisted accordingly.
Additional details
Audience: Leadership, management
Level of Analysis: Child, classroom or caseload, center
Difficulty: Moderate
Content Area: ERSEA, Education and Child Development, Health, Family and Community Engagement, Children with Disabilities, Program Management
Data Sources: Google Sheets, Domo
Contact
Keri Allred
Executive Director
RUCD Head Start
kallred@rucd.org