How does attendance vary by center?
In summer 2018, Merced County Office of Education’s Head Start (MCOE) embarked on a continuous quality improvement project around absenteeism. Absence rates by day across the whole organization showed the typical pattern that is most often observed in Early Head Start/Head Start programs: a moderate “U-shaped” curve in which Monday and Friday have higher absence rates than the other days, with Tuesday or Wednesday usually having the lowest absence rates.
Then, MCOE looked at each site individually and an interesting pattern was observed in a handful of sites: Tuesday was the highest absence day. By asking parents, they learned that in that specific community, the local food bank distributed food on Tuesdays and the logistics of early arrival and long wait times for the food meant that it was not possible for parents to bring their children to HS on Tuesdays. Now, MCOE is trying to find ways to work with the food bank in order to ease the burden on the HS families who use both services.
ANALYSIS
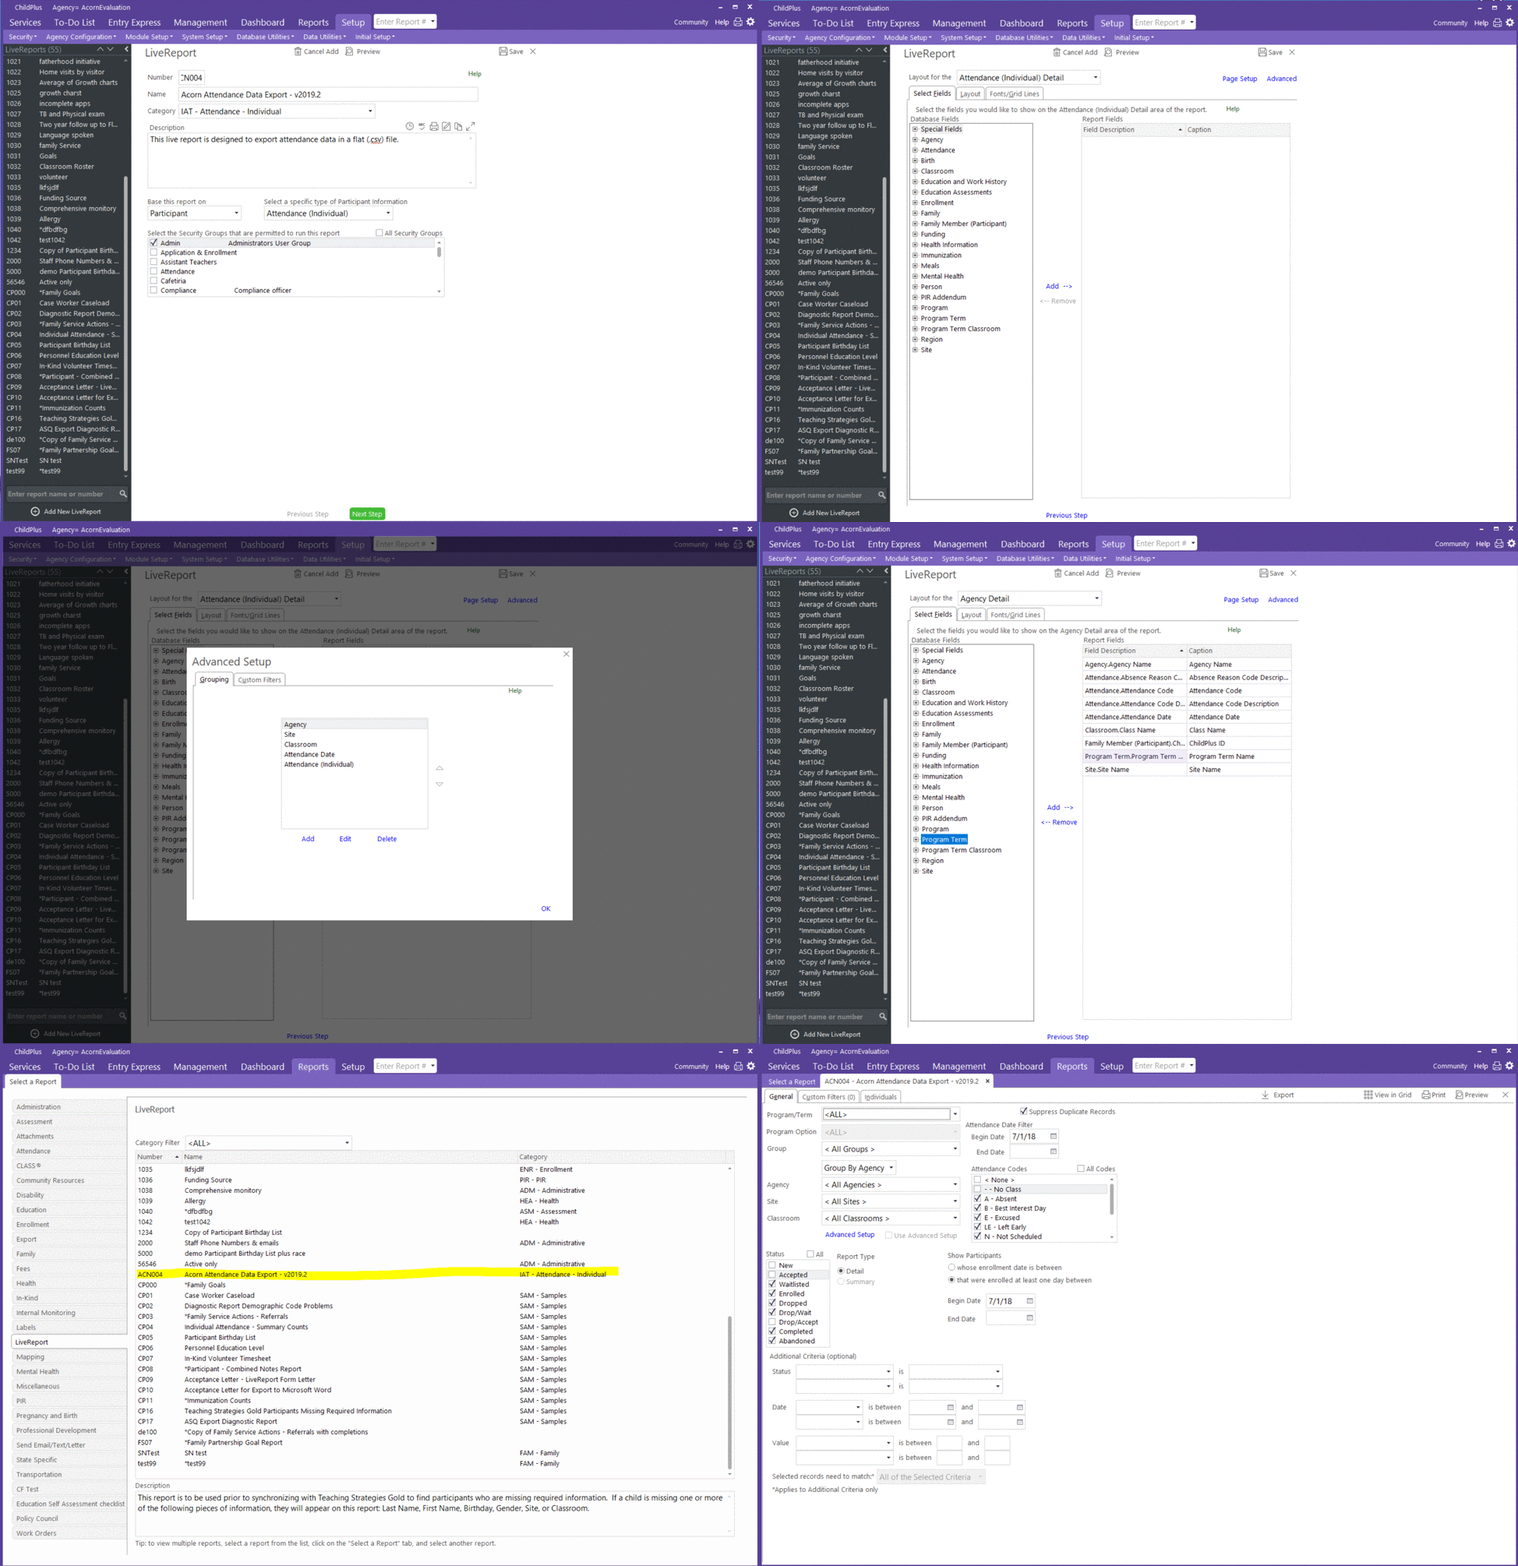
The data for this use case was entirely found in their ChildPlus software. To visualize the attendance data, it is first necessary to move the data out of ChildPlus and into data visualization software capable of generating the flexible visualizations that were desired. A custom “Live Report” was created using the standard features available (see Technical Appendix).
The exported live report data was imported into Tableau. The data was transformed from the raw tables into a series of visual representations of the data that showed patterns over time. The visualization that is the focus of this Use Case is the visualization of absence rates by the day of the week.
Chart 1 below shows the absence rates for MCOE as a whole across the days of the week. This shows the typical pattern that is most often observed in Early Head Start/Head Start programs: a moderate “U-shaped” curve in which Monday and Friday have higher absence rates than the other days, with Tuesday or Wednesday usually having the lowest absence rates.
Chart 1: MCOE Absence by Day of the Week – Agency as a Whole
Then, MCOE analyzed the rates for each site individually. In the exploration of variations across sites, an interesting pattern was observed in a handful of sites: Tuesday was the highest absence day, rather than the standard of Monday and Friday. Chart 2 below provides an example of one of these sites.
Chart 2: Absence by Day of the Week
RESULT
These data visualizations were used as part of internal discussions at MCOE about absence rates overall and per site. In this case, the graphs were shared with parents through the Family Services Advisory Committee meeting and with staff at the Family Advocacy Meeting.
The solution to the mystery was provided by the parents. They explained that in that specific community, the local food bank distributed food on Tuesdays and the logistics of early arrival and long wait times for the food meant that it was not possible for parents to bring their children to HS on Tuesdays. The parents present shared that the food bank has limited services in this community and only came once per week. The parents needed to make a decision that would best meet their family’s needs.
At present, this is a work-in-progress as MCOE works to find ways to work with the food bank in order to ease the burden on the HS families who use both services. In the next year, as efforts to find solutions advance, we can track the impact on absence rates. If the absence rates at these sites fall (hopefully overall, but at least on Tuesdays), we will know that we have successfully addressed this issue. During the next 5 years, MCOE will embark on identifying issues affecting attendance at each of sites using the daily attendance data for each site. Family Services staff will work closely with enrolled families to identify key issues affecting attendance on the days identified. Support will be provided to families to advocate and create change in their communities in an effort to improve daily attendance.
ADDITIONAL DETAILS
AUDIENCE: Management, leadership
LEVEL OF ANALYSIS: Center
DIFFICULTY: Advanced
CONTENT AREA: Attendance
DATA SOURCES: ChildPlus, Tableau
CONSIDERATIONS AND CAVEATS: Next steps could include: Drilling down to assess absence in terms of specific types of students or times of day. Implement ongoing monitoring to identify additional absence drivers and track impact of hypothesized solutions
TECHNICAL APPENDIX
The screenshots below were taken from ChildPlus Version 4.8.17.0. ChildPlus is the property of ChildPlus Software, Copyright 2019.
Questions about this use case? Email them to analytics@nhsa.org and we’ll get in touch with the author for you!


